This project is archived and is in readonly mode.
Possible memory leak in Rails 3

-
 Marc Baumbach
I've seen this problem as well. I've tried with both Mongrel and WEBrick and confirmed that enabling config.cache_classes resolves the problem in development mode. Without it, the ruby process consumes about 2MB of memory every request without releasing the memory, although that number is likely application/request dependent.
An easy way to reproduce it is to run a periodical updater from prototype for a little while. I ran an updater every 10 seconds and in less than an hour, my machine was becoming unresponsive and the server was completely unusable due to consuming so much memory.
-
 VirtualFunction
Ditto, I have this problem. I'm running from a recently compiled 1.9.x trunk and have this.
In case others watch this, I would like to draw to peoples attention that Ruby x64 does have issues with it leaking memory in 1.8.7 and 1.9.1 when using include / extends (http://redmine.ruby-lang.org/issues/show/1392) which in some cases might give similar effects (though it's easy to tell as the Ruby bug also leaks in production, typically because most association proxy modules use 'extends' semantics).
-
Marc Baumbach
I guess to give a more concrete idea of my environment: I'm running Mac OS X Snow Leopard (latest updates) and Ruby 1.8.7.
-
 Rizwan Reza
- Milestone cleared.
- State changed from new to open
I will inform Yehuda about this. Thanks for a good catch.
-
 Jeremy Kemper
- Assigned user set to Yehuda Katz (wycats)
-
 Yehuda Katz (wycats)
Are you running Rails master or Rails 3.0.0.beta?
-
Marc Baumbach
Not sure about everybody else, but I'm using Rails 3.0.0.beta.
-
 Phil Evans
I am also using Rails 3.0.0.beta.
-
 José Valim
I was not able to reproduce on master. If you guys can, please let us know.
-
Rizwan Reza
- Tag changed from memory leak, rails 3.0 beta to memory leak
Can anyone confirm this on master? I am unable to reproduce this. Thanks.
-
VirtualFunction
I've been using master for the last day and a bit, and it seems OK so far, no obvious leaks that I can see (though part of the reason I noticed this originally was a periodic AJAX call, which now seems to get cached as the development mode is now caching things that I've assigned page cache's to)
-
José Valim
- State changed from open to invalid
Sweet! If you notice the issue again, I will reopen the ticket.
-
Anthony Burns
I was still able to duplicate this error today using 1.9.1 and master. Happened during periodic AJAX calls, as well as with a continuous loop of requests to the root page of the app. However, setting config.cache_classes to true did fix the issue. I am on Ubuntu 9.10.
-
ddelco
I'm also seeing this error on 3.0.0.beta2, Ruby 1.8.7p248 on OS X. With config.cache_classes = false memory just balloons up with each request. Setting config.cache_classes = true looks like it resolves it.
-
ddelco
Also seeing this in master.
-
iHiD
I am seeing this on 3.0.0.beta2, Ruby 1.8.7p174 on Ubuntu.
It occurs on both mongrel and webrick. Tried with "rackup" and "rails s".
Thanks.
-
iHiD
This is fixed for me in edge as well. Thanks
-
Nolan Meyers
- Importance changed from to High
I am still having this issue with 3.0.0.beta4 on either ruby-1.9.2-head or ruby-1.9.1-p378. As everyone else has noted, it only happens in development when config.cache_classes is disabled.
-
Jeremy Kemper
- State changed from invalid to open
-
Wijnand Wiersma
I can confirm this. It seems to grow about 20Mb per request when running bundle exec rails s.
Ruby version:
ruby 1.8.7 (2009-06-08 patchlevel 173) [universal-darwin10.0] -
Wincent Colaiuta
Another "me too". Seeing this with 3.0.0.beta4 on stock standard Mac OS X Snow Leopard Ruby (1.8.7), only in development mode (cache_classes = false).
Start the server, real memory usage is 53.6MB. After the first 5 requests it's up to 100MB. Hammer the root path a 100 times with "ab" and it's up to 200MB. Basically it will swell up to consume as much real memory as the system will allow.
So basically I am in the habit now of CTRL-C'ing and rerunning "rails server" every few dozen requests, because the machine just starts getting too slow.
-
chaitanyav
Can we use the hijack gem to get a irb session to the process and dump the object space to see what is taking up all the memory?. This can give us lot of information about what is taking up all the memory.
-
 Alex Le
I can confirm this memory leak behavior too. I'm using Rails 3 beta 4 with rvm's ruby 1.8.7 (ruby 1.8.7 (2010-01-10 patchlevel 249) [i686-darwin10.3.0]) and in development mode, the server keeps eating up more and more memory. I usually have to restart the server to get the memory usage under control again.
-
beawesomeinstead
+1
I can confirm this on latest REE 1.8.7, Unicorn, Rails3 master as of today. Unicorn process is being SIGKILL-9'ed by kernel after few requests, because it starts to consume 100% cpu and 100% memory.
-
chaitanyav
Can someone please post sample app so that we can all reproduce the problem
-
 James Le Cuirot
I take it no one has seen this in 2-3-stable? I witnessed some horrendous memory leaks today after updating Rails from 94878c61a329891eb904ace5b06dbc50831869d8 (around 2.3.6) to the latest from that branch. It actually ground our server to a halt so badly that I couldn't access it anymore. It's been fine since dropping back to the older code. I still need to investigate it further but I thought it was worth mentioning here.
-
Jacob Coby
+1 here. I took an existing 2.3.8 app under development and upgraded to rails 3 beta4. I see an approximately 2mb memory leak every request with no upper limit. Reverting back to 2.3.8 fixes the problem.
ruby 1.8.7 (2009-06-12 patchlevel 174) [universal-darwin10.0]
I tried using hijack but it wasn't able to attach to the process.
-
José Valim
Could someone please publish an application on Github where the leak exists so someone can investigate?
-
James Le Cuirot
Ignore what I said, the 2-3-stable leak did not apply to master and has now been fixed.
-
Thiago Moretto
Same problem, 3.0.0.beta4, 1.8.7 on Snow Leopard in development mode. I tested a very simple Rails 3 application, requesting from browser and seems memory grow up, and never seems to lower. I booted another application with 2.3.8 and with same MRI 1.8.7 and no problems.
See attached screenshot. The first process (5952) is the rails3 app and the second (6144) is the 2.3.8. Both using sqlite3 and in development mode.I have a another application that gets slower with time. But I can't share. I need to restart after some few minutes. With same configurations above.
My tested rails3 app is here:
http://github.com/thiagomoretto/agiumHow I can extract a memory dump to help?
-
 rails3_possivel_memoryleak.png
38.2 KB
rails3_possivel_memoryleak.png
38.2 KB
-
-
chaitanyav
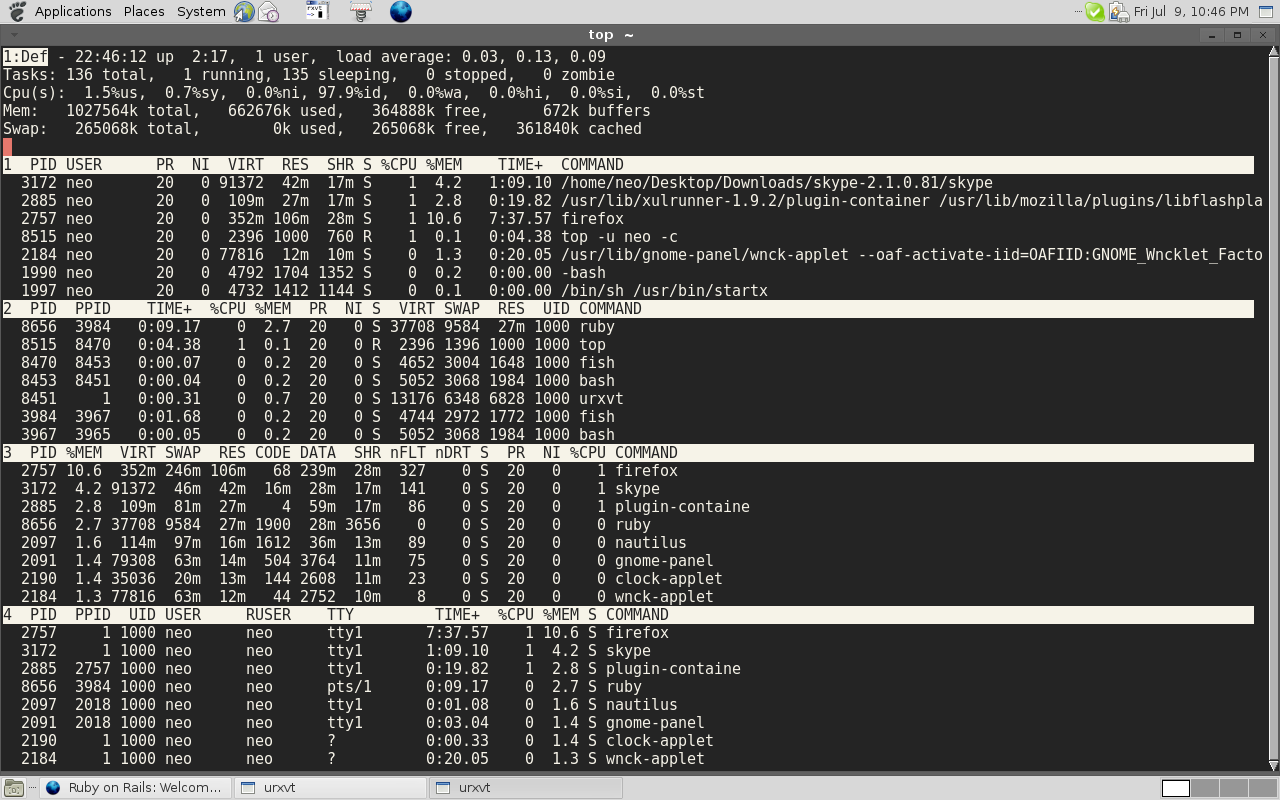
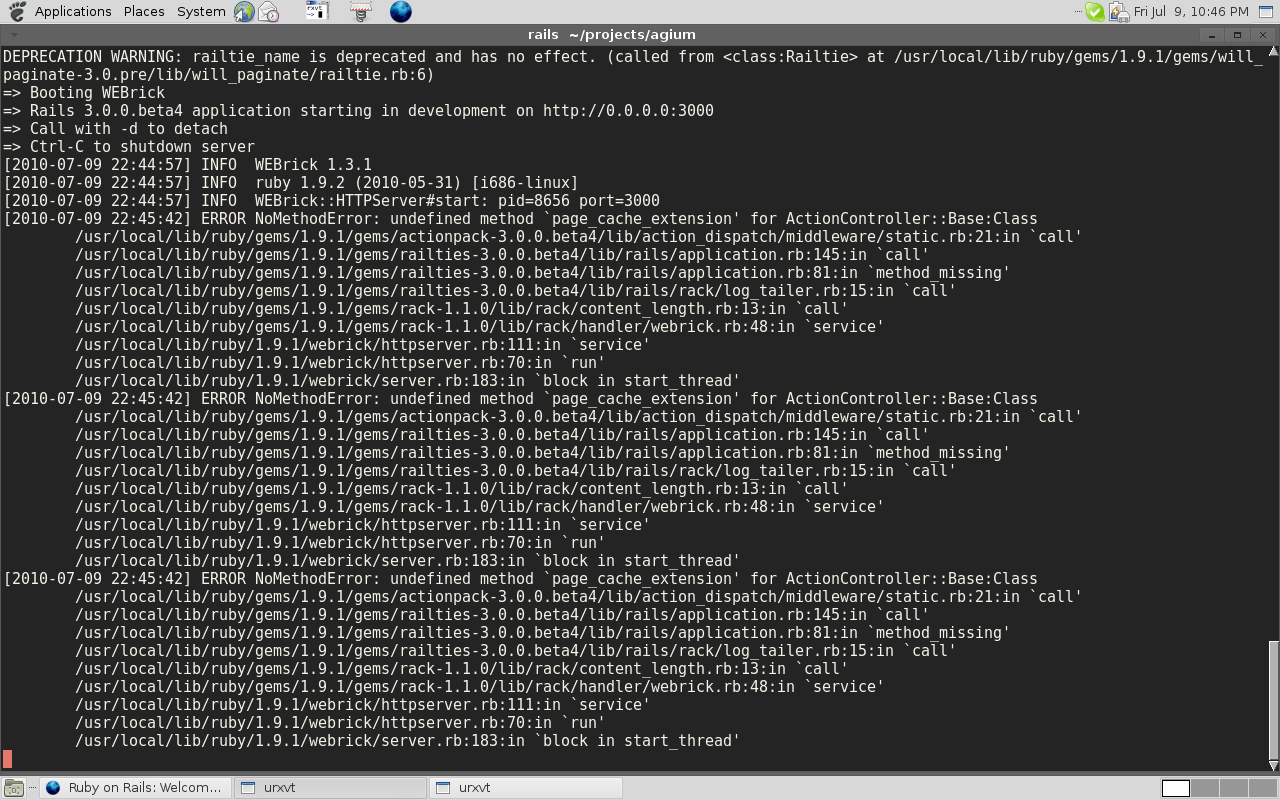
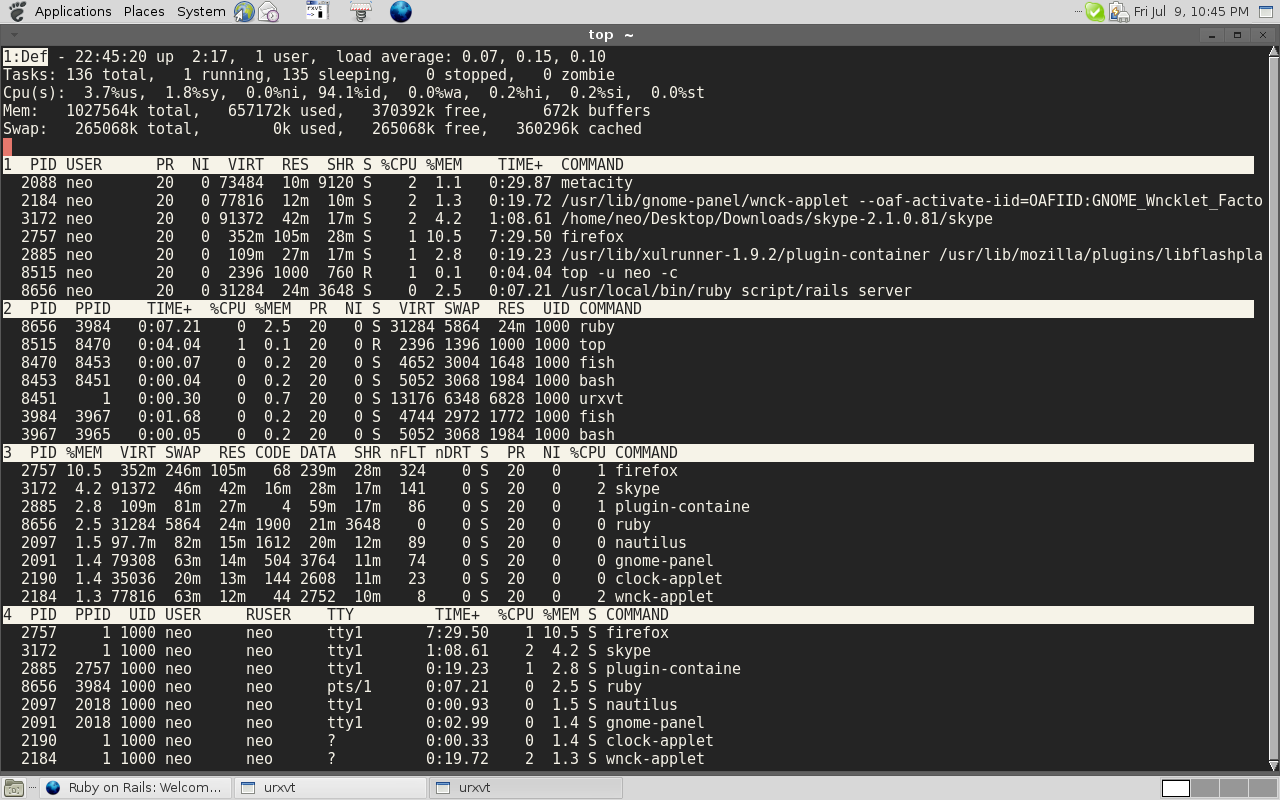
I was able to reproduce the issue, I ran the code @thiago posted on github. I looked at top output after the server was started, the res was 24m . After hitting the main page http://localhost:3000/ for 20-30 times continously. The res went to 27m.In the middle there was a internal server error, I captured the screenshot of the server output when the internal server error occured. Also attached a screenshot of my env. I will try to dump the object space using hijack and post my findings.
-
 after_few_hits.png
186 KB
after_few_hits.png
186 KB
-
 internal_server_error.png
214 KB
internal_server_error.png
214 KB
-
 server_start.png
189 KB
server_start.png
189 KB
-
 env.png
163 KB
env.png
163 KB
-
-
 Aman Gupta
@Thiago Thanks for the repro case. I was able to reproduce your leak (using rake db:migrate db:seed and then hitting http://localhost:3000/users repeatedly after adding some users) and track it down to AR validations. This leak has already been fixed in rails3 master and the fix will be included in rc1.
-
Stephan Kaag
Just curiosity: Aman can you specify the commit where this was fixed?
-
 iain
iainConfirming that it has been fixed rc1: I tested a medium sized Rails 3.0.0.beta4 app with 'ab':
0 requests: 94.2MB
50 requests: 268.0MB
100 requests: 320.8MB
200 requests: 515.3MB
300 requests: 695.9MB
500 requests: 1.42GBAnd with ref:06b9531 (just moments before rc1 got released):
0 requests: 94.5MB
50 requests: 158.0MB
100 requests: 156.2MB
200 requests: 152.5MB
300 requests: 155.5MB
500 requests: 173.5MB
1000 requests: 161.0MBUsing ruby 1.8.7 (2010-04-19 patchlevel 253) [i686-darwin10.4.0], MBARI 0x6770, Ruby Enterprise Edition 2010.02
-
Aman Gupta
@Stephan This commit fixed it: http://github.com/rails/rails/commit/b67ec8ba20099c8b39bf344f385bbb...
Before this commit, all validations were added to ActiveRecord::Base._validators instead of the actual model classes themselves.
ruby-1.8.7-p174 > ActiveRecord::Base._validators
 => {}

ruby-1.8.7-p174 > User
 => User(id: integer, login: string, password: string, admin: boolean, created_at: datetime, updated_at: datetime)

ruby-1.8.7-p174 > ActiveRecord::Base._validators
 => {:login=>[#<ActiveModel::Validations::PresenceValidator:0x104e7f220 @attributes=[:login, :password], @options={}>, #<ActiveRecord::Validations::UniquenessValidator:0x104e7b9e0 @attributes=[:login], @options={:case_sensitive=>true}, @klass=User(id: integer, login: string, password: string, admin: boolean, created_at: datetime, updated_at: datetime)>], :password=>[#<ActiveModel::Validations::PresenceValidator:0x104e7f220 @attributes=[:login, :password], @options={}>]}
You can view the leak in more detail in the following heap dump: http://bit.ly/bn1EvM
-
-
Rizwan Reza
- State changed from open to resolved
-
-
Jake Dempsey
I am seeing this same problem. I have a rails 2.3.9 app that I converted to rails 3. Currently in development mode I see my ruby process grow by nearly 20mb on each request.
I am running:
OSX 10.6
Rails 3.0.3
REE ruby 1.8.7 (2010-04-19 patchlevel 253) [i686-darwin10.4.1], MBARI 0x6770, Ruby Enterprise Edition 2010.02Here are the numbers of my ruby process:
0 Requests (just started app): 74.7mb
1 Request: 76.2mb
2 Request: 91.7mb
3 Request: 110.7mb
4 Request: 126.4mb
5 Request: 144.5mbIf i set config.cache_classes in dev mode to true:
0 Request: 67.5mb
1 Request: 69.5mb
2 Request: 70.8mb
3 Request: 72.1mb
4 Request: 73.4mb
5 Request: 74.1mb -
Jake Dempsey
I found out what my issue was.. thought I would just reply here to show my findings
I have created a small rails app here: https://github.com/angelo0000/memory_leak_test
My problem is that I was requiring a file on my model from my lib dir:(MyLib which has a class level instance variable that is a Set of other classes). In one of my models I would add self to the MyLib class list (a way to do self registering for something) and the memory would just grow and grow. The issue was being caused because my model class was reloaded on each request but my MyLib class was not. When my model class loads, it then says MyLib.add(self) and self would be a new instance of the class on every request because of the class reloading.
If I made no sense on the prev paragraph you can always just clone the git repo above and launch the rails app. If you go to the root url you should see the number of objects in MyLIb and the current memory footprint. Just hit refresh and you can see it grow. You can comment out the require in the user.rb, restart, and hit the root url again to see that only 1 object gets put in.
-
VirtualFunction
@Jake...
A lot of people don't realise, but you need to be very carefult if you are using class level variables or assigning any non primative type to a constant (If you do, I strongly suggest using .freeze to ensure you don't get memory leaks)
Conversely, any class level variables that come are using in classes that get reloaded from the Rails dependency handler will often loose data between requests.
For instance, if you do something like (trivial example):
class Post < Activerecord::Base
acts_as_tree @@root = root endcould have some bad side effects in production because @@root doesn't get unloaded in production, and if this AR instance has loads of chilren non of the children ('i.e. @@root.children) will not get unloaded.
You'll want to use freeze or stay away from complex data types for constants or class variables: e.g.
class Post < Activerecord::Base
acts_as_tree @@root = root.freeze endIn the case of your repo code, the 'User class' will be a different object after each reload and like you say you get loads of objects in your set from all the different instances of User that get loaded. (You'll find in production it shouldn't leak, however I'd probably store strings and use a getter method that calls .contantize)
-
Jake Dempsey
@VirtualFunction
I wasn't using class variables, but I agree with your observation. My main problem was with the User class reloading and when being added to my set, it was a different instance of that class so my Set really didnt work. I couldn't do a freeze because this is a registration mechanism that can actually occur at runtime. I just created that simple app to highlight my problem.
I def agree with your observation about storing the the class name instead. I actually made that change last night after I realized what the problem was.
-
José Valim
Jake,
Active Support provides a reference system since Rails 3. Here is an example from Devise:
https://github.com/plataformatec/devise/blob/master/lib/devise.rb#L...
It is just a reference and ensures it always point to the live object. Consequently you won't leak. I will write a blog post about it on Plataforma's blog later.
-
stevo84
I see it is resolved, but I still experience the same behaviour in development - and it quickly eats out my memory (around 40MB per request).
ruby 1.8.7 (2010-04-19 patchlevel 253) [x86_64-linux], MBARI 0x6770, Ruby Enterprise Edition 2010.02
Rails 3.0.3
Ubuntu 10.10 (maverick) - kernel 2.6.35-24-generic -
 Matt D
I'm still dealing with memory leaks. I don't have many details now, since I'm just beginning to investigate, but I observed leaks with Ruby 1.9.2 on Rails 3.0.3 on a skeleton app :/ Will post when I find out more (and probably inevitably discover that it's my fault).
-
 asoules (at gmail)
I'm having this problem in Rails 3.0.3 using Ruby 1.8.7 or 1.9.2. I've tried thin, mongrel, webrick, no luck there.
config.cache_classes = truefixes the leak, but that's obviously less than ideal :) -
-
asoules (at gmail)
The leak that I am suffering from appears to be caused by AASM, not Rails. Check out the question posted by Jens on StackOverflow: http://stackoverflow.com/questions/5369623/tracing-memory-leak-in-r...